Table Extraction from Diagrams & Documents
By Jason Hu & Jo-Anne Ting
March 2, 2020
Vast amounts of valuable information exist in industrial diagrams and document images which are vital to a number of areas in industrial operations, such as project planning and design. In this area, tabular information typically contains inventory and specification data that must be accurately extracted to ensure on-time project implementation and completion. Traditionally, this information has been captured through time-intensive, error-prone manual methods. Machine learning strategies enable faster, more accurate extraction. This has a wide variety of applications beyond project engineering.
1. Two categories of data entry errors
Manual transcription can lead to human error. Data entry errors can be divided into two broad categories:
- Transcription errors are errors made when transcribing contents from the source drawing / document image to the destination spreadsheet / CSV. This kind of error includes typos, repetitions, and omissions. Such errors are caused by hitting the wrong key, erroneous computer-assisted auto-correction or even incorrect reading of text
- Transposition errors occur when information is sorted in the wrong order. For example, “123” could be transcribed as “132”, or an entry on row 1 could be misplaced in row 2. Transposition errors are almost always human in origin.
Transcription and transposition errors are inevitable in all writing and typing activities. Errors and mistakes can be quite costly, resulting in unnecessary re-work due to mis-specifications or delay due to insufficient inventory.
Fortunately, explosive progress in the field of computer vision and deep learning has provided a pathway to increase automation in data entry tasks, allowing for faster and more accurate transcriptions and for reducing fatigue and stress on engineers. You can read more about these strategies below.
2. How do you extract information from tables?
There are two activities involved when extracting tables from digital images and drawings:
- Detection of the table
- Subsequent extraction of its contents into a digital format like a CSV file
Let’s revisit how tables are defined. A table is a structure with data arranged in columns and rows. There are two types of tables that commonly appear in industrial diagrams and documents.
Structured tables: All cells in these tables are bounded by clearly defined lines making it clear how the information is structured and organized. Figure 1 shows a sample structured table. Interpretation is intuitive and straightforward, with no further guidelines needed.
Unstructured tables: Not all cells in these tables are bounded by lines. Figure 2 shows an example, where table columns and rows are not separated by grid lines. Although information is conveyed in a semantically organized way, the table structure can be ambiguous. Interpretation may be challenging, especially if there are inconsistent indentation and formatting of text in rows, columns, and cells.

Figure 1: A sample structured table
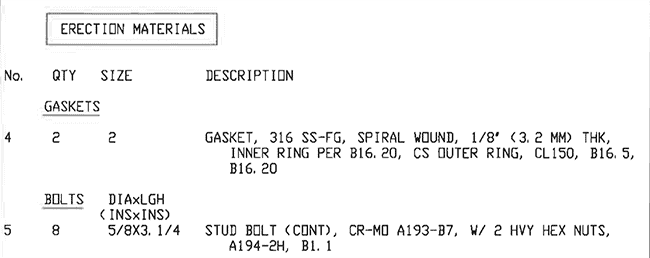
Figure 2: A sample unstructured table
3. Which strategies can you use to automatically extract info from tables?
Next, we describe how you can perform both table extracting activities automatically via machine learning and computer vision approaches. Note that we consider only document images and not documents with searchable text (e.g., PDFs with no text metadata or embedded text data that’s searchable), since tabular data extraction is trivial in these text-readable documents.
Structured and unstructured tables have different characteristics and need to be dealt with differently:
- Structured tables have cells outlined by gridlines. By detecting lines (e.g., applying a Hough Transformation), you can first extract the table structure from the image and identify the number and location of rows, columns, and resulting cells. Text information can then be extracted via Optical Character Recognition (OCR). OCR has enjoyed a lot of success in recent years, with attention-based and transformer-based deep learning models producing very strong results. Deep learning-based OCR approaches tend to be more robust and generalizable than traditional computer vision techniques. This is due to the ability of deep networks to cope with variations in images such as occlusions, deformation, background clutter, illumination, and viewpoints.
- Unstructured tables typically have no grid lines and need a different approach. Spacing is used to recognize and define the structure for this type of table to identify the number and location of rows, columns, and resulting cells. Table structure recognition based on visual semantics introduces more transposition errors, especially when solutions are fully automatic. A human-in-the-loop solution can reduce these transposition errors by soliciting human correction for results that have higher predictive variance (or, equivalently, lower predictive confidence). In this way, unstructured tables can also be extracted with as high accuracy as structured tables, given some minimal human input.
4. Summary
Developments in the field of deep learning and computer vision have enabled automation in areas that were previously labor intensive and error prone. Automated information extraction in digital document images allows you to supervise the process if/when needed, reducing your time spent extracting information from tables and increasing the quality of the outputs. Choosing the right approaches can significantly improve any endeavor requiring fast, accurate extraction of tabular data, whether from bill of materials tables, part lists, line designation tables, instrument indices, data sheets, production reports or other PDF documents.