Data Science in Oil & Gas: Observations & Thoughts from ATCE 2019

At ATCE I presented my work Analyzing Fractures Using Time-Lapse Electric Potential Data. Read more about the topics at the event here.
I recently attended the Society of Petroleum Engineers Annual Technical Conference (ATCE) in Calgary and presented my work Analyzing Fractures Using Time-Lapse Electric Potential Data. In a nutshell, I showed a new way of using electric potential data in unconventional settings that allows for better production monitoring, as well as other applications.
ATCE 2019: DIGITAL TRANSFORMATION
The main theme of ATCE 2019 was Digital Transformation, and many talks at the conference centered around applying data science to traditional Oil and Gas research (e.g. drilling and reservoir engineering). This year’s ATCE had more diverse data science topics than last year’s. In particular, there were two themes of research that I found interesting:
- Equipment monitoring & predictive maintenance
- Time-series classification using deep learning,
Both of which relate to the work we do here at Arundo.

THEME 1: EQUIPMENT MONITORING AND PREDICTIVE MAINTENANCE
Improving Deepwater Facility Uptime Using Machine Learning introduced a data-driven way to predict unplanned downtime on subsea production systems. In this work, a PCA-based clustering model was used to monitor a VRU (Vapor Recovery Unit Compressors) system, and a deep learning-based autoencoder (see Figure 1) was used to monitor an FGC (Flash Gas Compressors) system. The paper showed convincing results, suggesting that both models are good candidates to monitor dynamic physical systems. Additionally, the authors described the complexity of deploying their models in real-time.
While I might not necessarily agree with the modeling decisions, I found the concepts on operationalizing data science models for equipment monitoring right on the money. In summary:
- Decomposing and grouping the sensors by different subsystems of the equipment for more granular diagnosis and better root cause analysis
- Maintaining and re-training the model when the model performance degrades
- Deploying data-driven models using a cloud platform is more scalable and sustainable in the long term
These are ideas that we have arrived at independently and incorporated into the design of some of our work, based on our own experience of working with heavy industry equipment.

THEME 2: TIME-SERIES CLASSIFICATION USING DEEP LEARNING
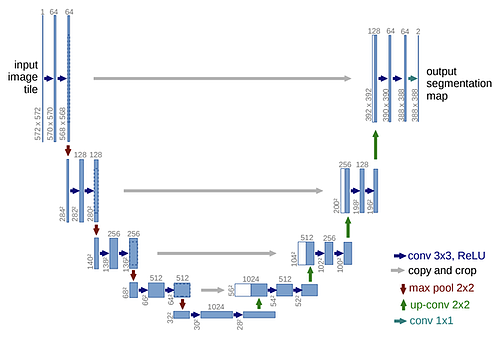
The second trend I saw at ATCE was the use of convolution neural networks in time-series analysis. In Developing an Integrated Real-Time Drilling Ecosystem to Provide a One-Stop Solution for Drilling Monitoring and Optimization, U-Net -- a deep learning model commonly used in image segmentation -- is used to classify drilling state such as rotate or slide with great precision. In Automatic Drilling Dynamics Interpretation Using Deep Learning, a convolutional neural network is used to classify different types of vibration event.
Both these papers parallel the initiative we started last year to use convolutional neural networks for time-series anomaly detection. In our paper, Time Series Anomaly Detection Using Convolutional Neural Network and Transfer Learning, we used a U-net-based segmentation network (see Figure 2) in a transfer learning framework so that the model is pre-trained on synthetic data, followed by fine-tuning on data sets with previous unseen classes of anomalies

FINAL THOUGHTS
I’m glad to see more mature development of data science related research in the Oil and Gas industry. Deep learning is being leveraged to perform time-series analysis in more companies compared to previous years. As research becomes more mature, operationalizing these models in day-to-day workstreams & procedures will be the next hurdle. That’s a topic for another post.
Stay tuned!


